July 2014
PE REPORT
Report Outlines Science and Engineering Workforce Trends
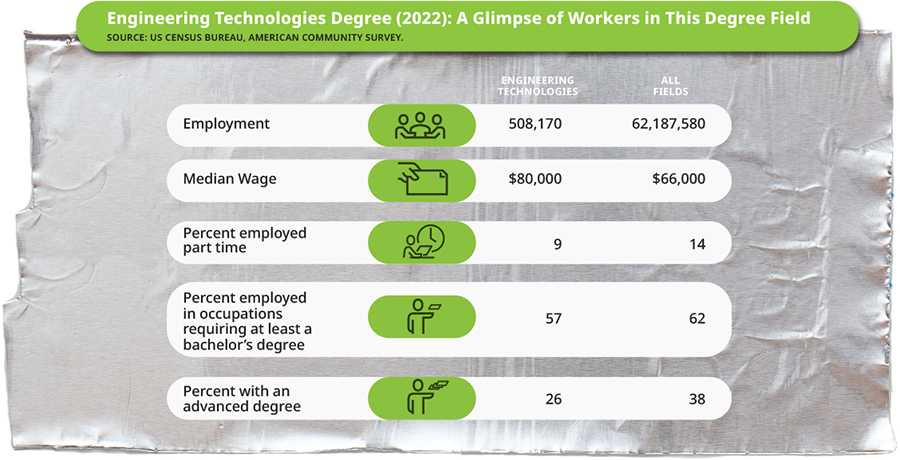
From 2008 through 2012, while overall US employment was contracting, science and engineering employment increased by 353,520 jobs, a compounded annual growth rate of 1.5%, according to the latest Congressional Research Service’s Science and Engineering Workforce report.
The report pegs the number of employed scientists and engineers in the US in 2012 at 6.2 million. S&E employment was concentrated in two occupational groups, computer occupations (56%) and engineers (25%); the rest were managers (9%), physical scientists (4%), life scientists (4%), and mathematical occupations (2%).
The mean annual wage for all scientists and engineers was $87,330 in 2012 while the mean annual wage for all occupations was $45,790.
The report notes that the Bureau of Labor Statistics projects that the number of S&E jobs will grow by more than 953,000 between 2012 and 2022. The BLS also projects that 1.3 million scientists and engineers will be needed to replace exiting workers. The S&E workforce needs 2.3 million in order to meet growth and replacement needs during this period, which includes more than 544,300 engineers.
How can the US foster development of the S&E workforce to meet future needs? The report recommends that federal policies focus on the following actions:
- Increasing the number of students pursuing S&E degrees;
- Increasing the number of foreign scientists and engineers admitted to the US;
- Growing the number and share of underrepresented minorities and women in science and engineering;
- Improving K–12 science, technology, math, and engineering education; and
- Improving career information and counseling for high school students.
S&E Occupations with the Largest Employment Growth, 2008–2012
- Software Developers, Applications—92,180
- Network and Computer Systems Administrators—22,470
- Mechanical Engineers—18,930
- Petroleum Engineers—15,530
- Aerospace Engineers—12,620
- Software Developers, Systems Software—9,870
- Operations Research Analysis—8,320
- Computer Hardware Engineers—6,210
- Electrical Engineers—5,890
- Industrial Engineers—5,550
Top 10: Mean Annual Wages of Engineers, 2012
- Petroleum Engineers—$147,470
- Nuclear Engineers—$107,140
- Aerospace Engineers—$104,810
- Computer Hardware Engineers—$103,980
- Chemical Engineers—$102,270
- Marine Engineers and Naval Architects—$96,140
- Electronics Engineers, except Computer—$95,250
- Engineers, All Others—$93,330
- Electrical Engineers—$91,810
- Mining and Geological Engineers, including Mining Safety Engineers and Inspectors—$91,250


 Volunteering at NSPE is a great opportunity to grow your professional network and connect with other leaders in the field.
 The National Society of Professional Engineers (NSPE) encourages you to explore the resources to cast your vote on election day:


